Interpreting the Results
The PCIE Status table shows information about the link. You can review the data to see whether the link is operating at the correct speed with the correct number of lanes.
The eye plot gives a visual representation of the link quality. Areas that are black have no errors reported. The yellow, orange, and red colors indicate how many errors are being found (yellow is less while red is more).
The bathtub view shows another representation of the link quality. The colors represent the same link quality levels as the eye view. Use the Bathtub View and Eye View buttons to switch between the views.
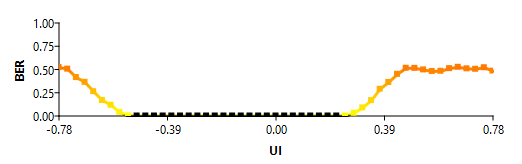
You can use the plot to see if the error-free area (or eye) is sufficient for your application. For example, for a PCIe Gen4x4 interface, the unit interval (UI) for PCIe Gen4 is 62.5 picoseconds (refer to the PCI-SIG's PCI Express® Base Specification for more information). In the PCIe Gen4x4 plot:
- One horizontal step is approximately three millivolts.
- One unit interval is 64 steps. A UI is a full window (between the X of the eye diagram).
- A step, therefore, is close to 1 picosecond.