Using the mark_debug Synthesis Attribute
You can use the attribute, mark_debug, to mark the debug nets for auto
debug probe insertion. You include the mark_debug synthesis attribute
in your RTL and set it to true or 1. If the attribute
is set to true or 1, synthesis tool writes out the
selected signal to a default file, <project
dir>/outflow/debug_profile.mark_debug.json. In the
Project Editor, you can enable or disable the
mark_debug output by setting the synthesis option
enable-mark-debug to 1 (default, enabled) or
0 (disabled).
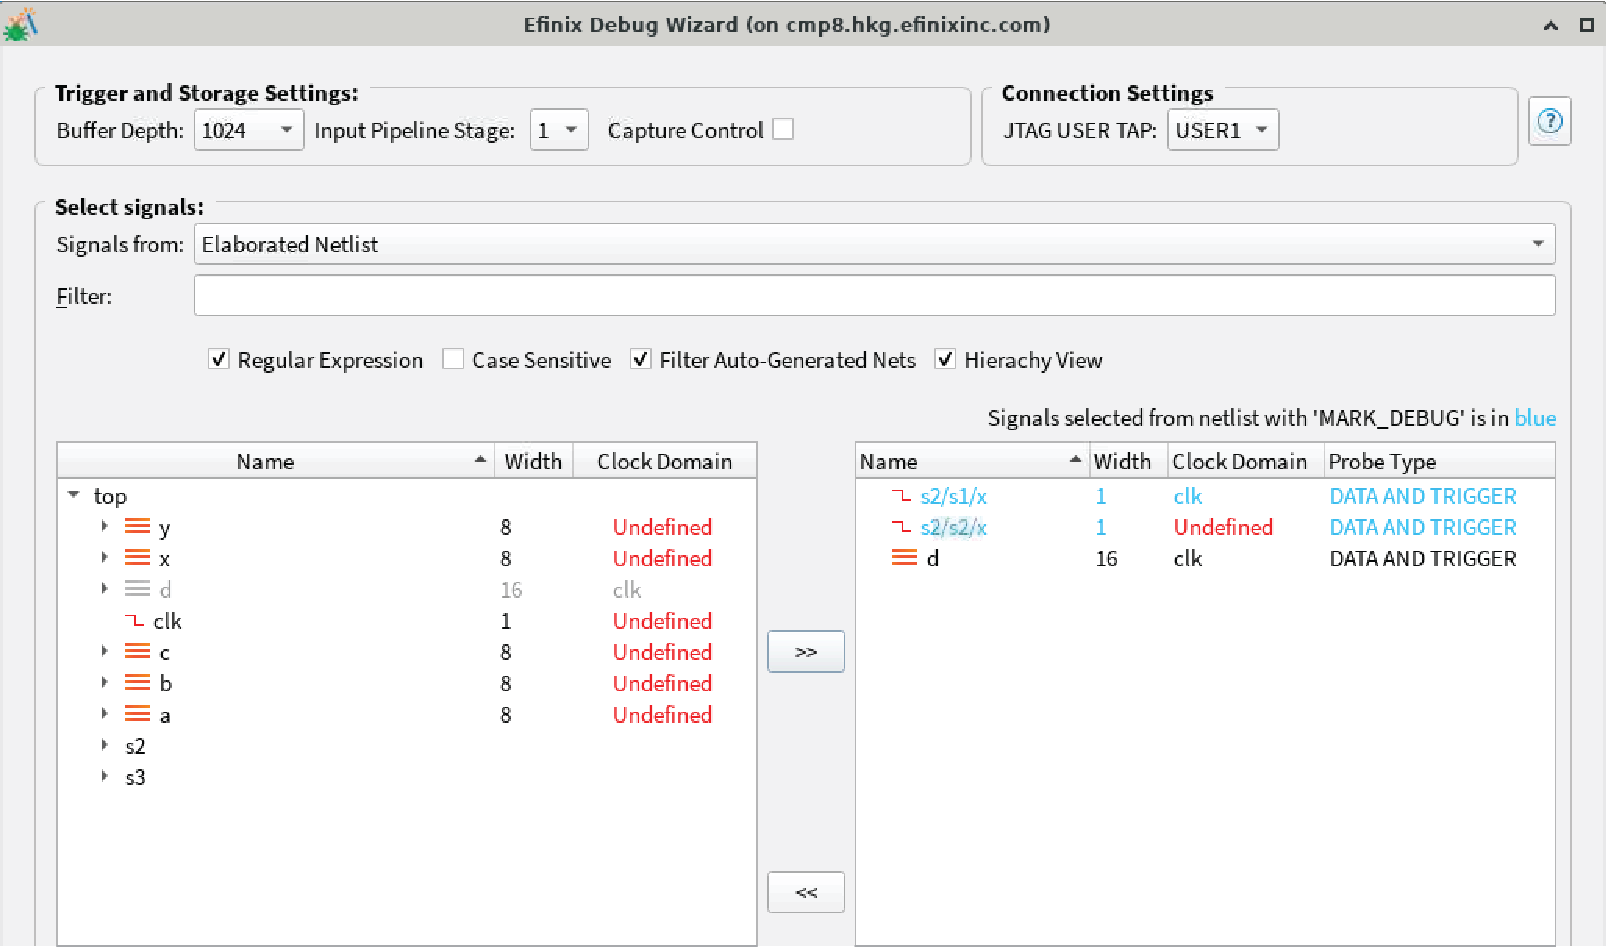
mark_debug signals (highlighted in blue in the following figure).
In the Debug Wizard, you can:- Edit the attributes related to the selected signal, e.g., clock domain and trigger type.
- Add additional signals from the design to be probed or remove the selected
mark_debugsignals.
mark_debug attribute in your RTL, you must re-run the Debug Wizard
to reimport the selected or changed signals. The changes are retained if the same signal
is selected and if the debug attribute has changed before.efx:debugger
section manually:- Turn on auto instantiation.
- Specify the debug profile value as outflow/debug_profile.mark_debug.json.
<efx:debugger>
   <efx:param name="work_dir" value="work_dbg" value_type="e_string"/>
   <efx:param name="auto_instantiation" value="on" value_type="e_bool"/>
   <efx:param name="profile" value="outflow/debug_profile.mark_debug.json" value_type="e_string"/>
</efx:debugger>data_depth, default =1024capture_control, default =falseinput_pipeline, default =1jtag_user, default =USER1
For each of the probe signals, the clock domain is deduced automatically. However, the clock domain is left as Undefined for a pure combinational signal. In this case, you can edit the JSON file to specify the desired clock domain. This information is retained when the JSON file is regenerated in future synthesis runs.