Debug
About this task
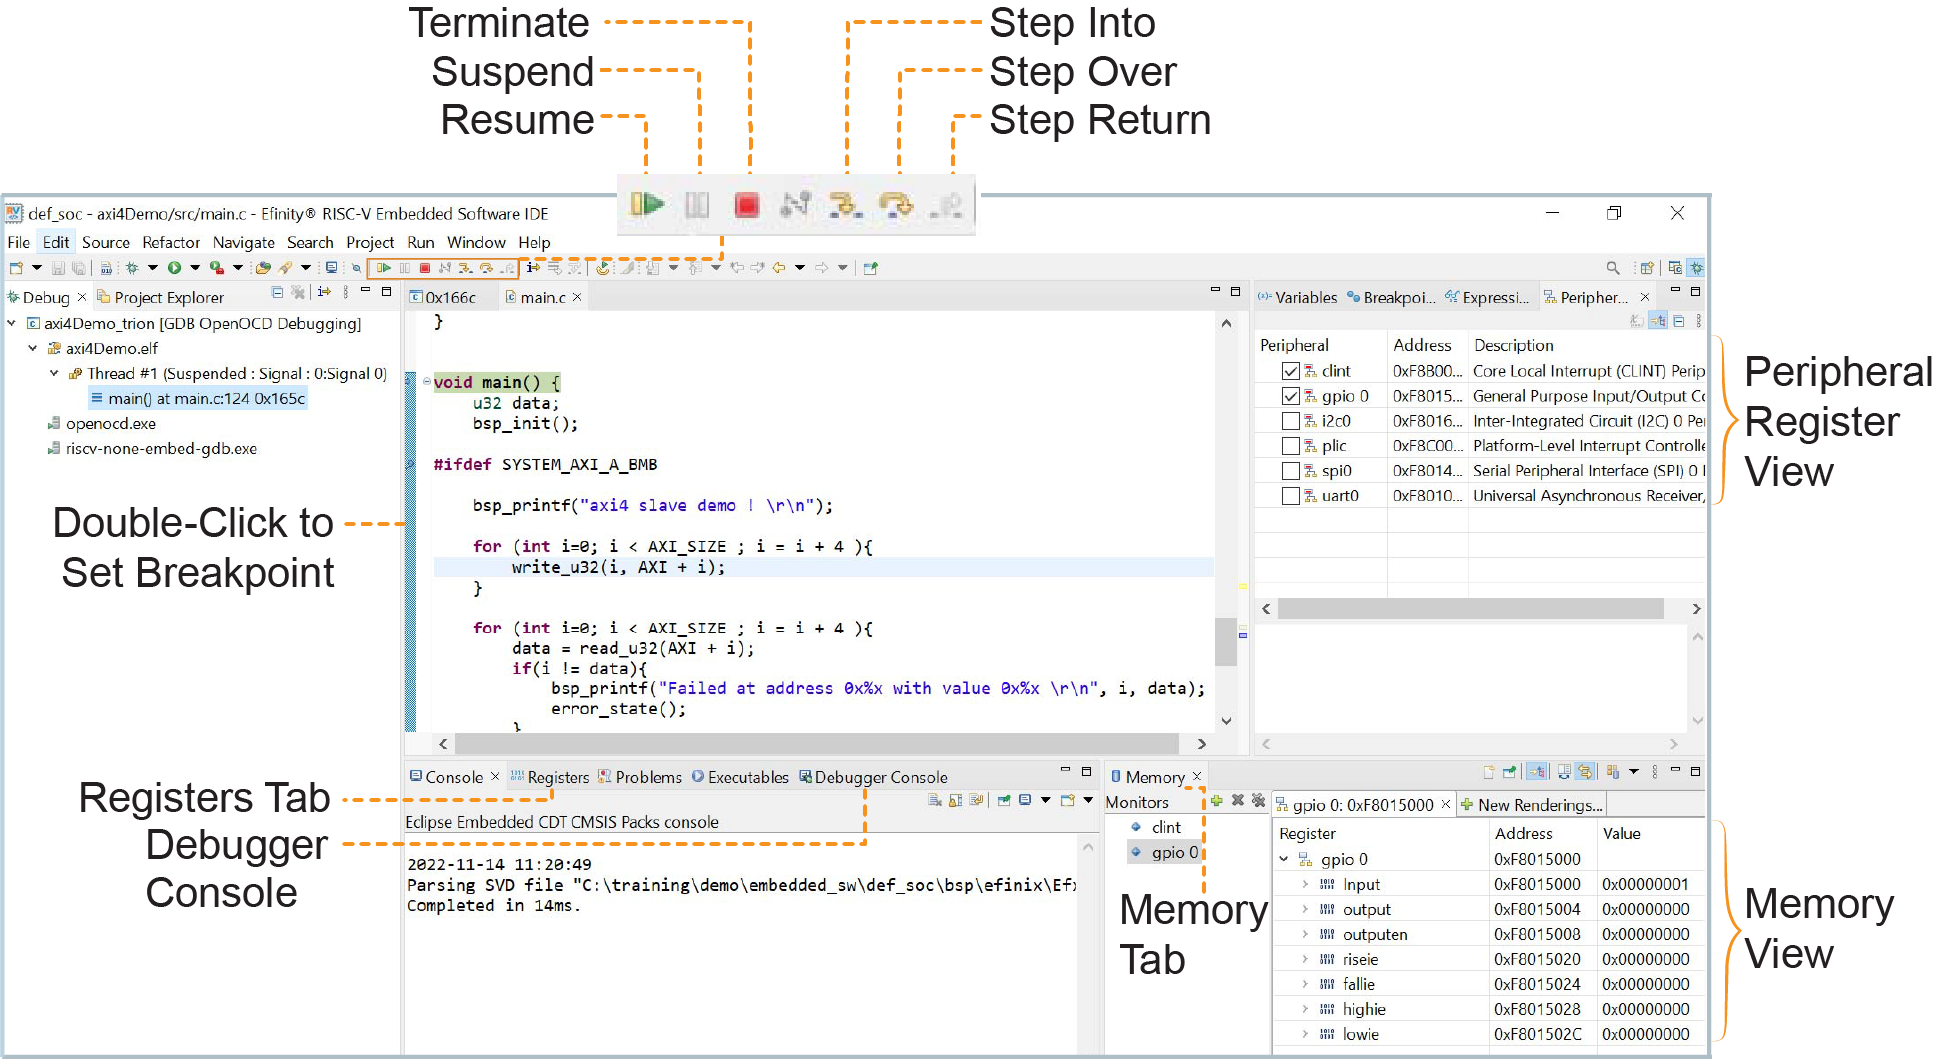
After you click Debug in the Debug Configuration window, the OpenOCD server starts, connects to the target, starts the gdb client, downloads the application, and starts the debugging session. Messages and a list of VexRiscv registers display in the Console. The main.c file opens so you can debug each step.
Procedure
- Click the Resume button or press F8 to resume code operation.
- Click Step Over (F6) to do a single step over one source instruction.
- Click Step Into (F5) to do a single step into the next function called.
- Click Step Return (F7) to do a single step out of the current function.
- Double-click in the bar to the left of the source code to set a breakpoint. Double-click a breakpoint to remove it.
- Click the Registers tab to inspect the processor's registers including the CSR registers.
- Click the Memory tab to inspect the memory contents including the Peripheral register monitors.
- Click the Suspend button to stop the code operation.
- Turn on any peripheral in the Peripheral pane to add the peripheral to the Memory monitor.
- When you finish debugging, click Terminate to disconnect the OpenOCD debugger.
Results
Notice: For more information on debugging with Eclipse, refer to
Running and debugging projects in the
Eclipse documentation.