Enable Concurrent Debugging
About this task
To use concurrent debugging, follow these steps:
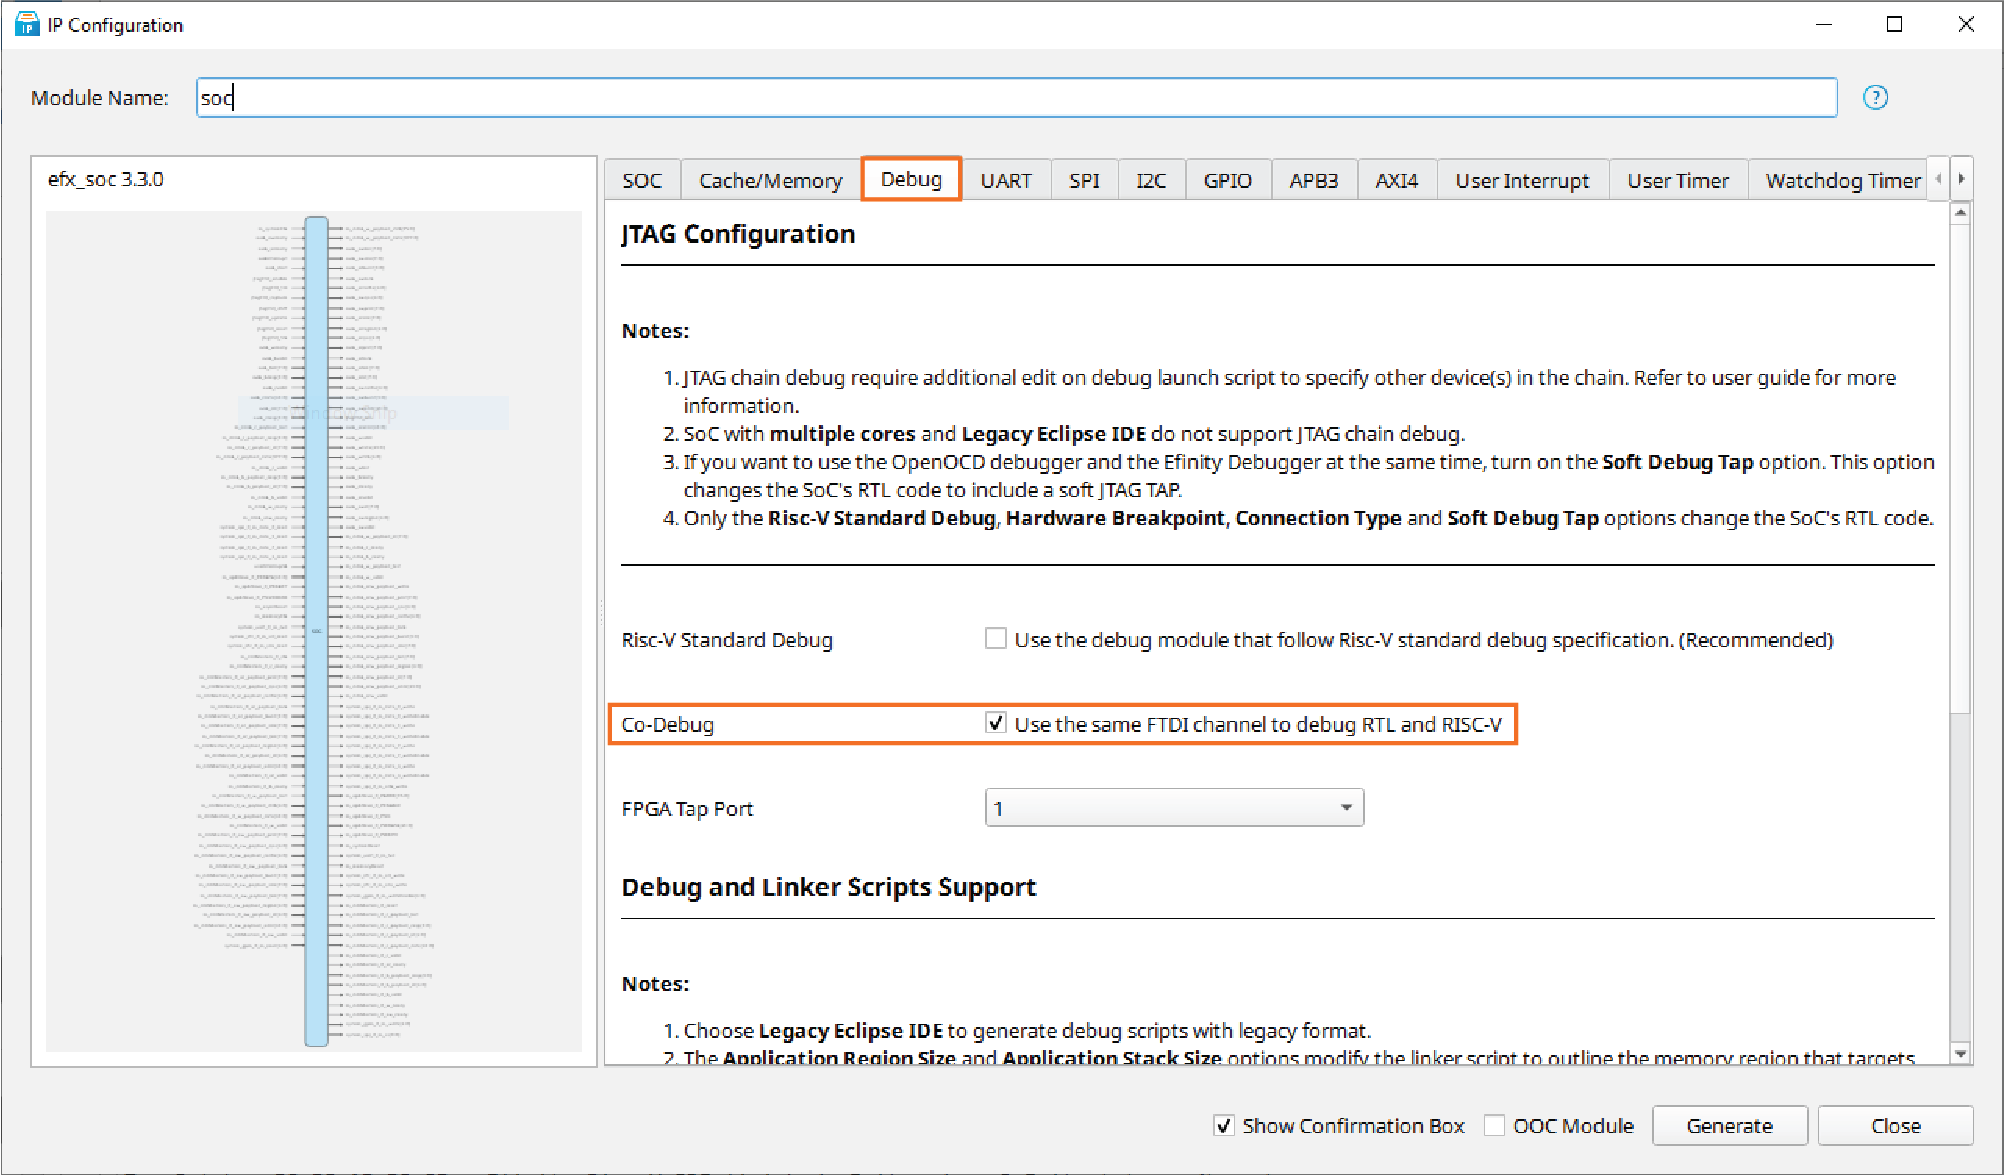
- On the Debug tab, turn on the Co-Debug option in efx_soc IP configuration.
- In the Efinity Debug Wizard, set up the signals and compile the project.
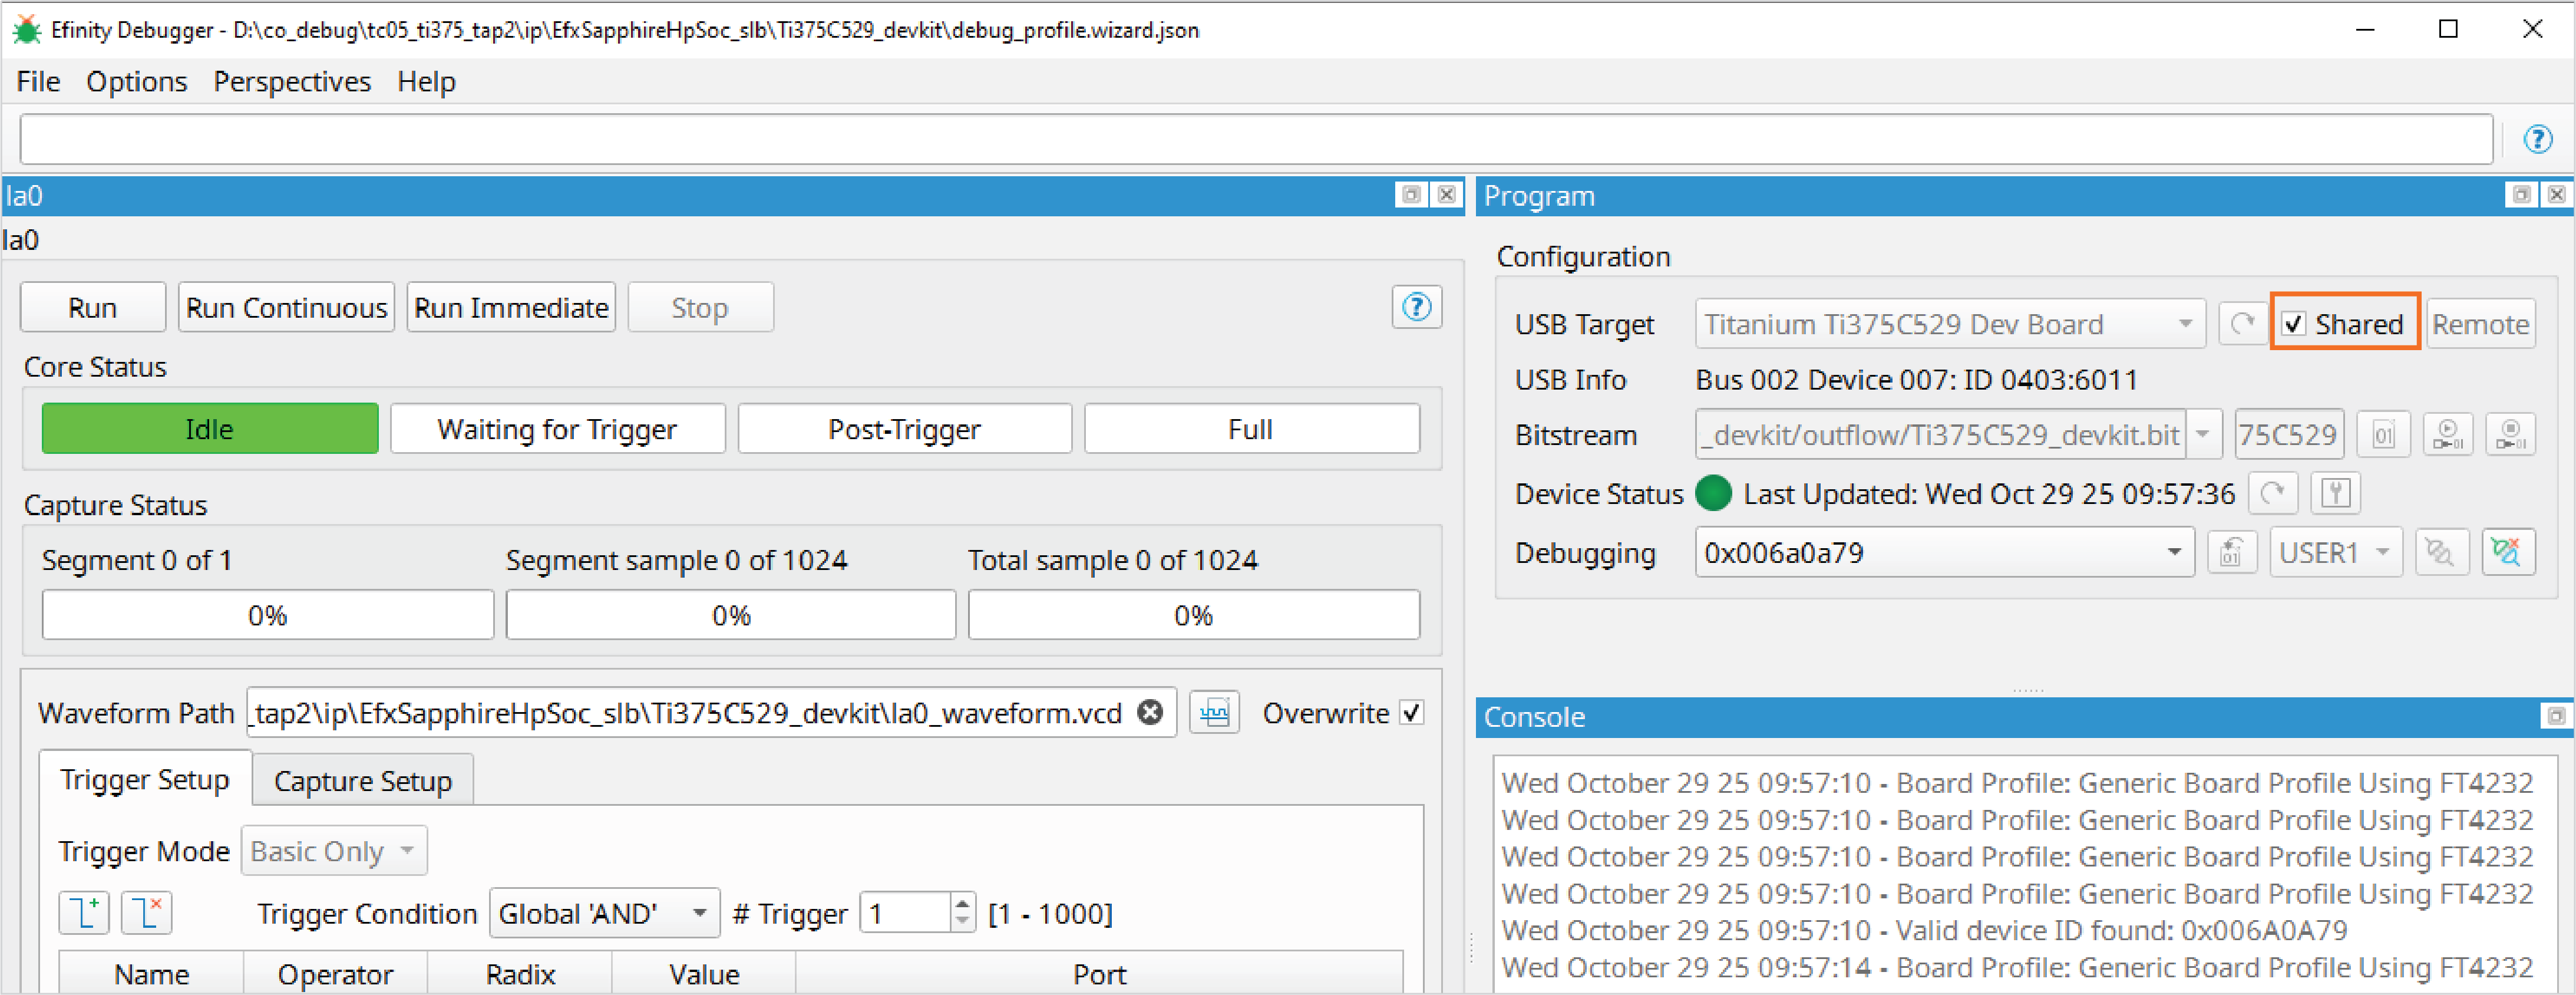
- Open the Debugger and turn on the Shared option.
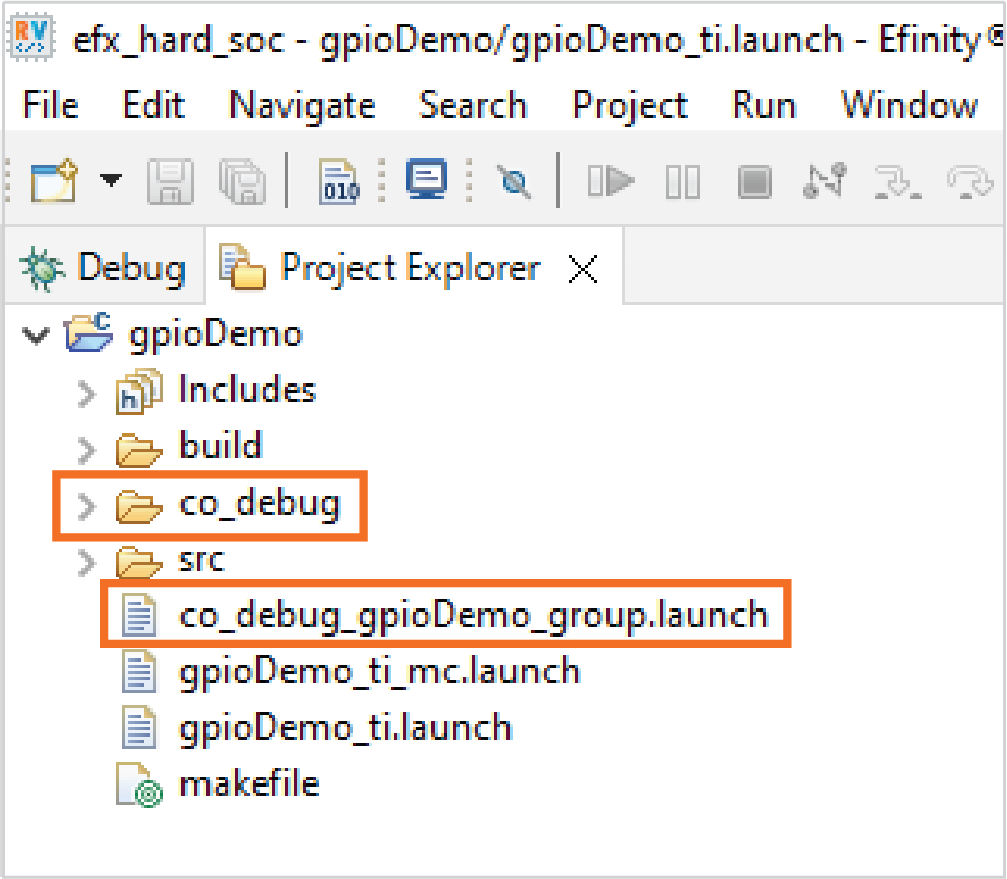
- Launch the RISC-V Embedded Software IDE and import the target project.
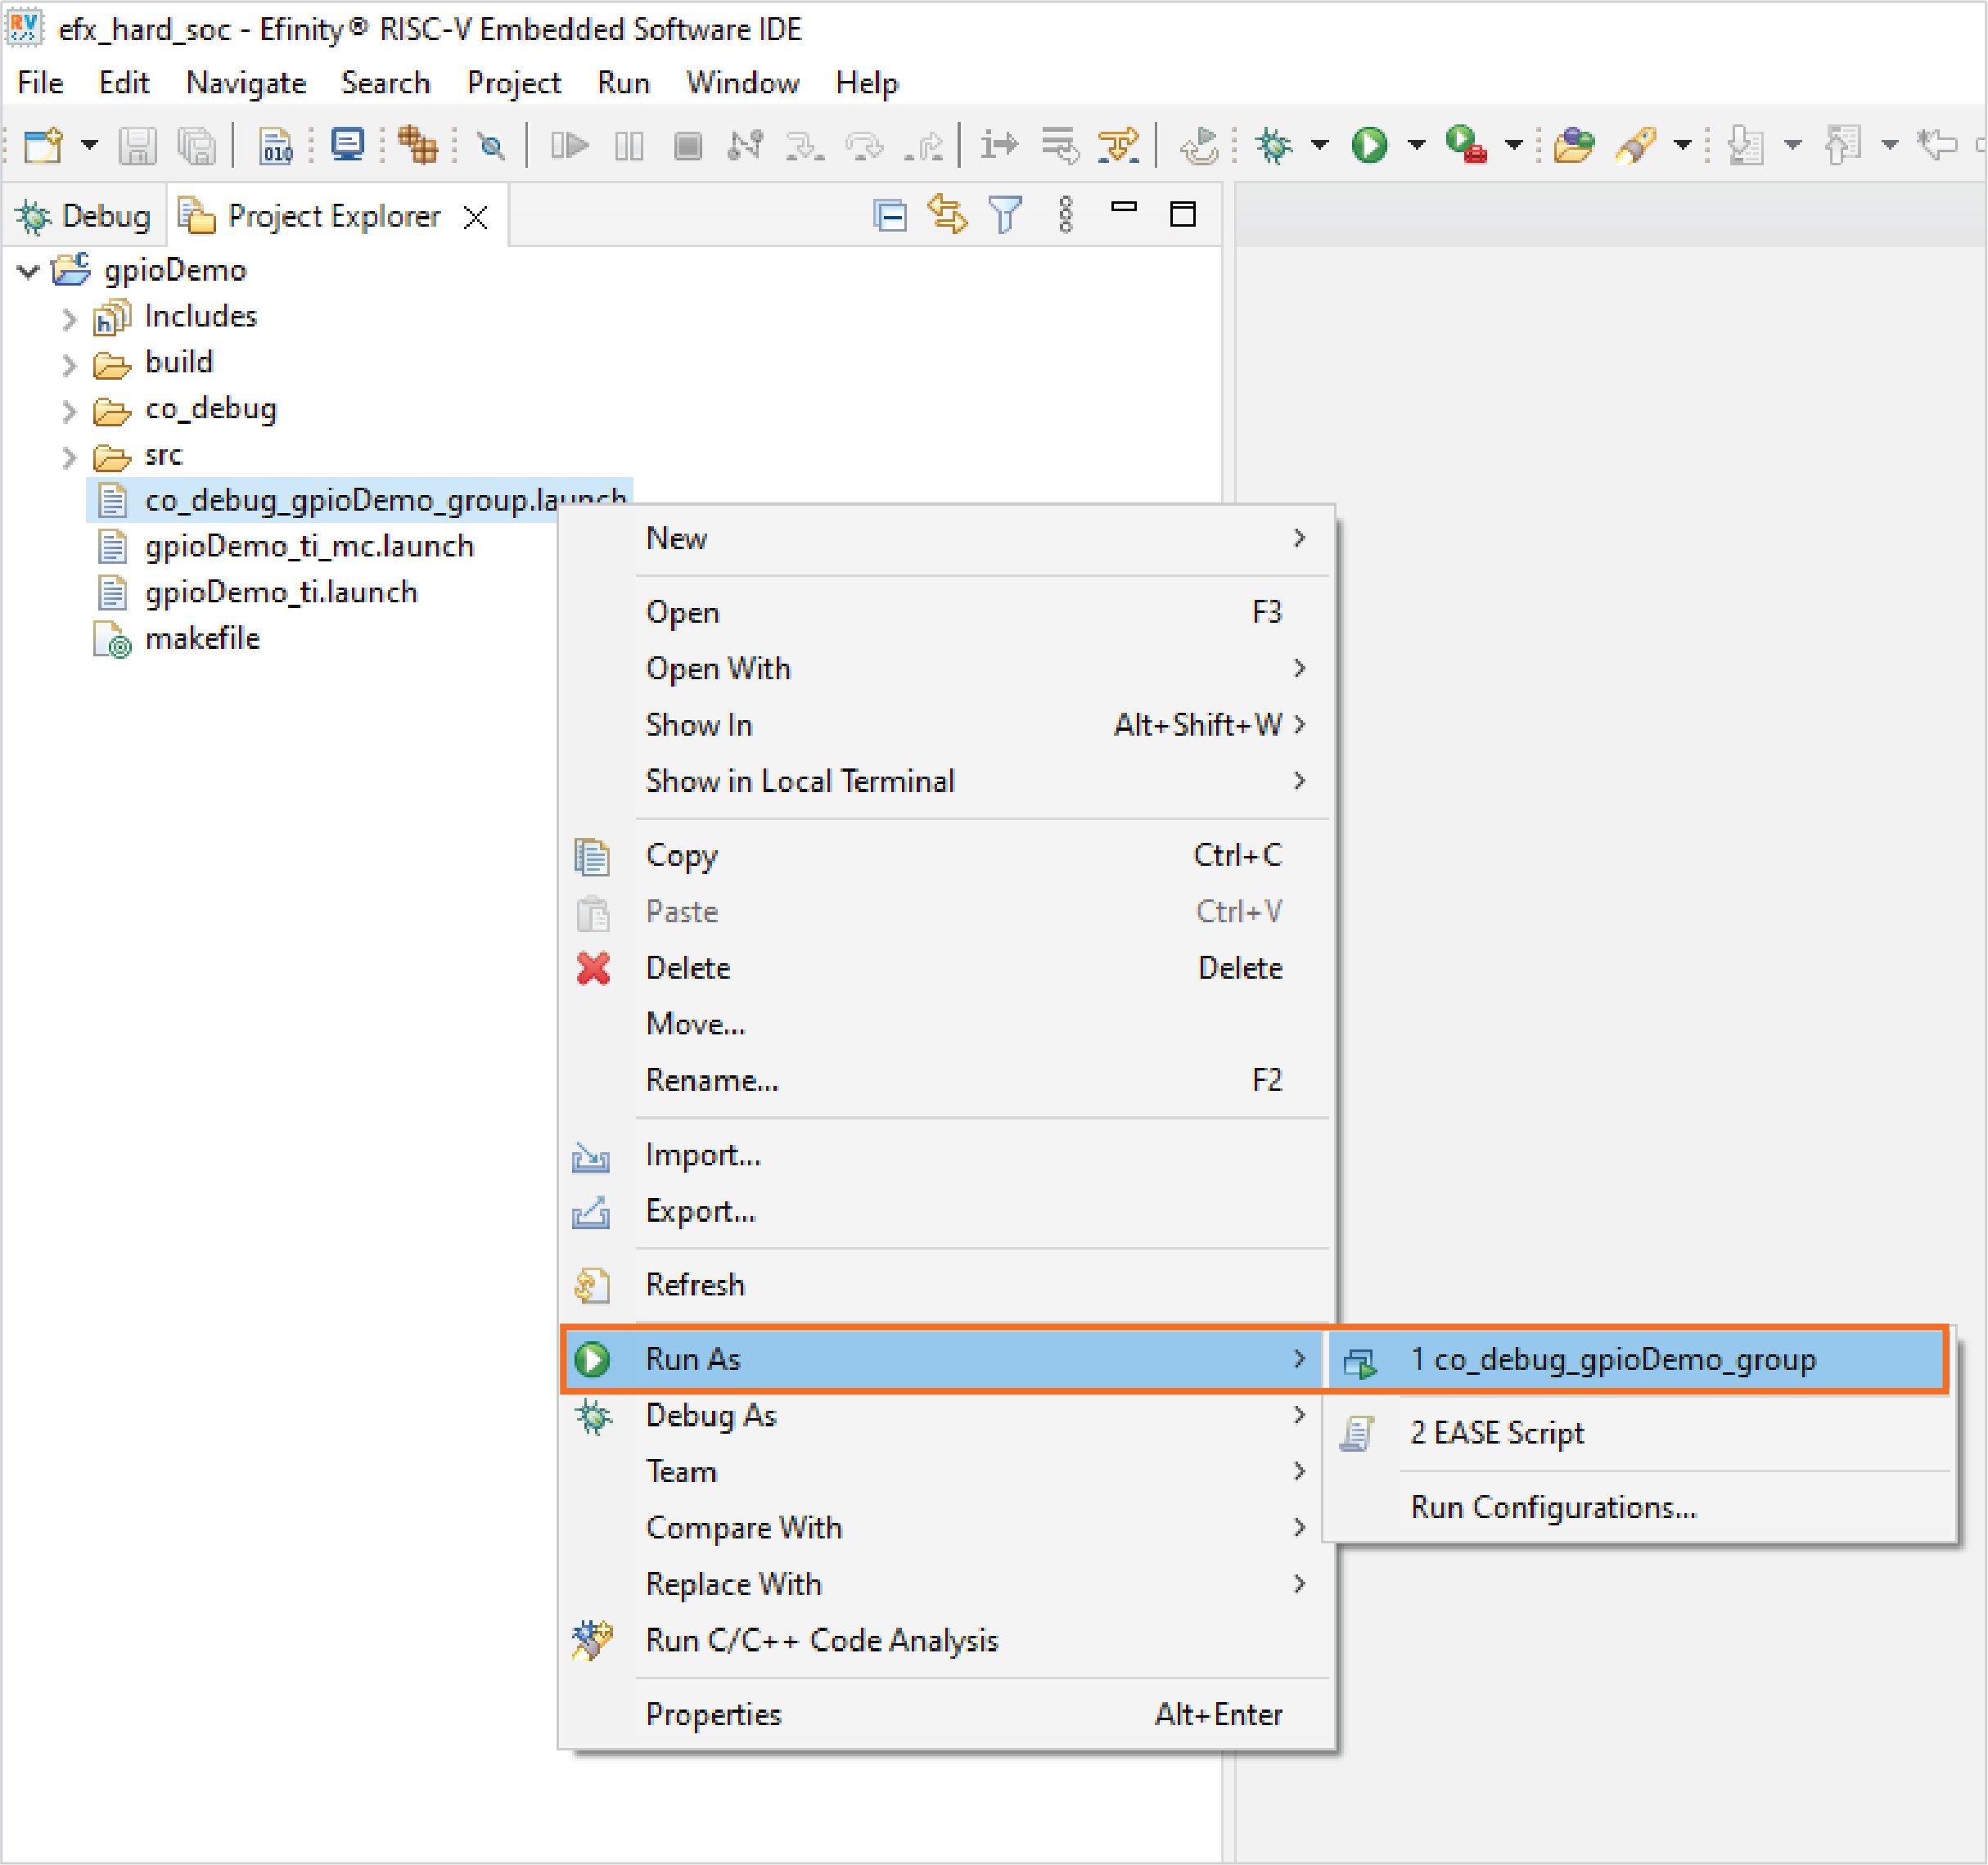
- Right-click on group.launch and select on Run/Debug.
- Use the Debugger to perform the RTL debugging.
You can use both debugging processes at the same time; they do not interfere with
each other.
Note: Co-debug only works with the FPGAs JTAG User TAP interface. When you turn on
Co-Debug, the Soft Debug Tap
option is hidden. Conversely, when you turn on Soft Debug
Tap, the Co-Debug option is
hidden.
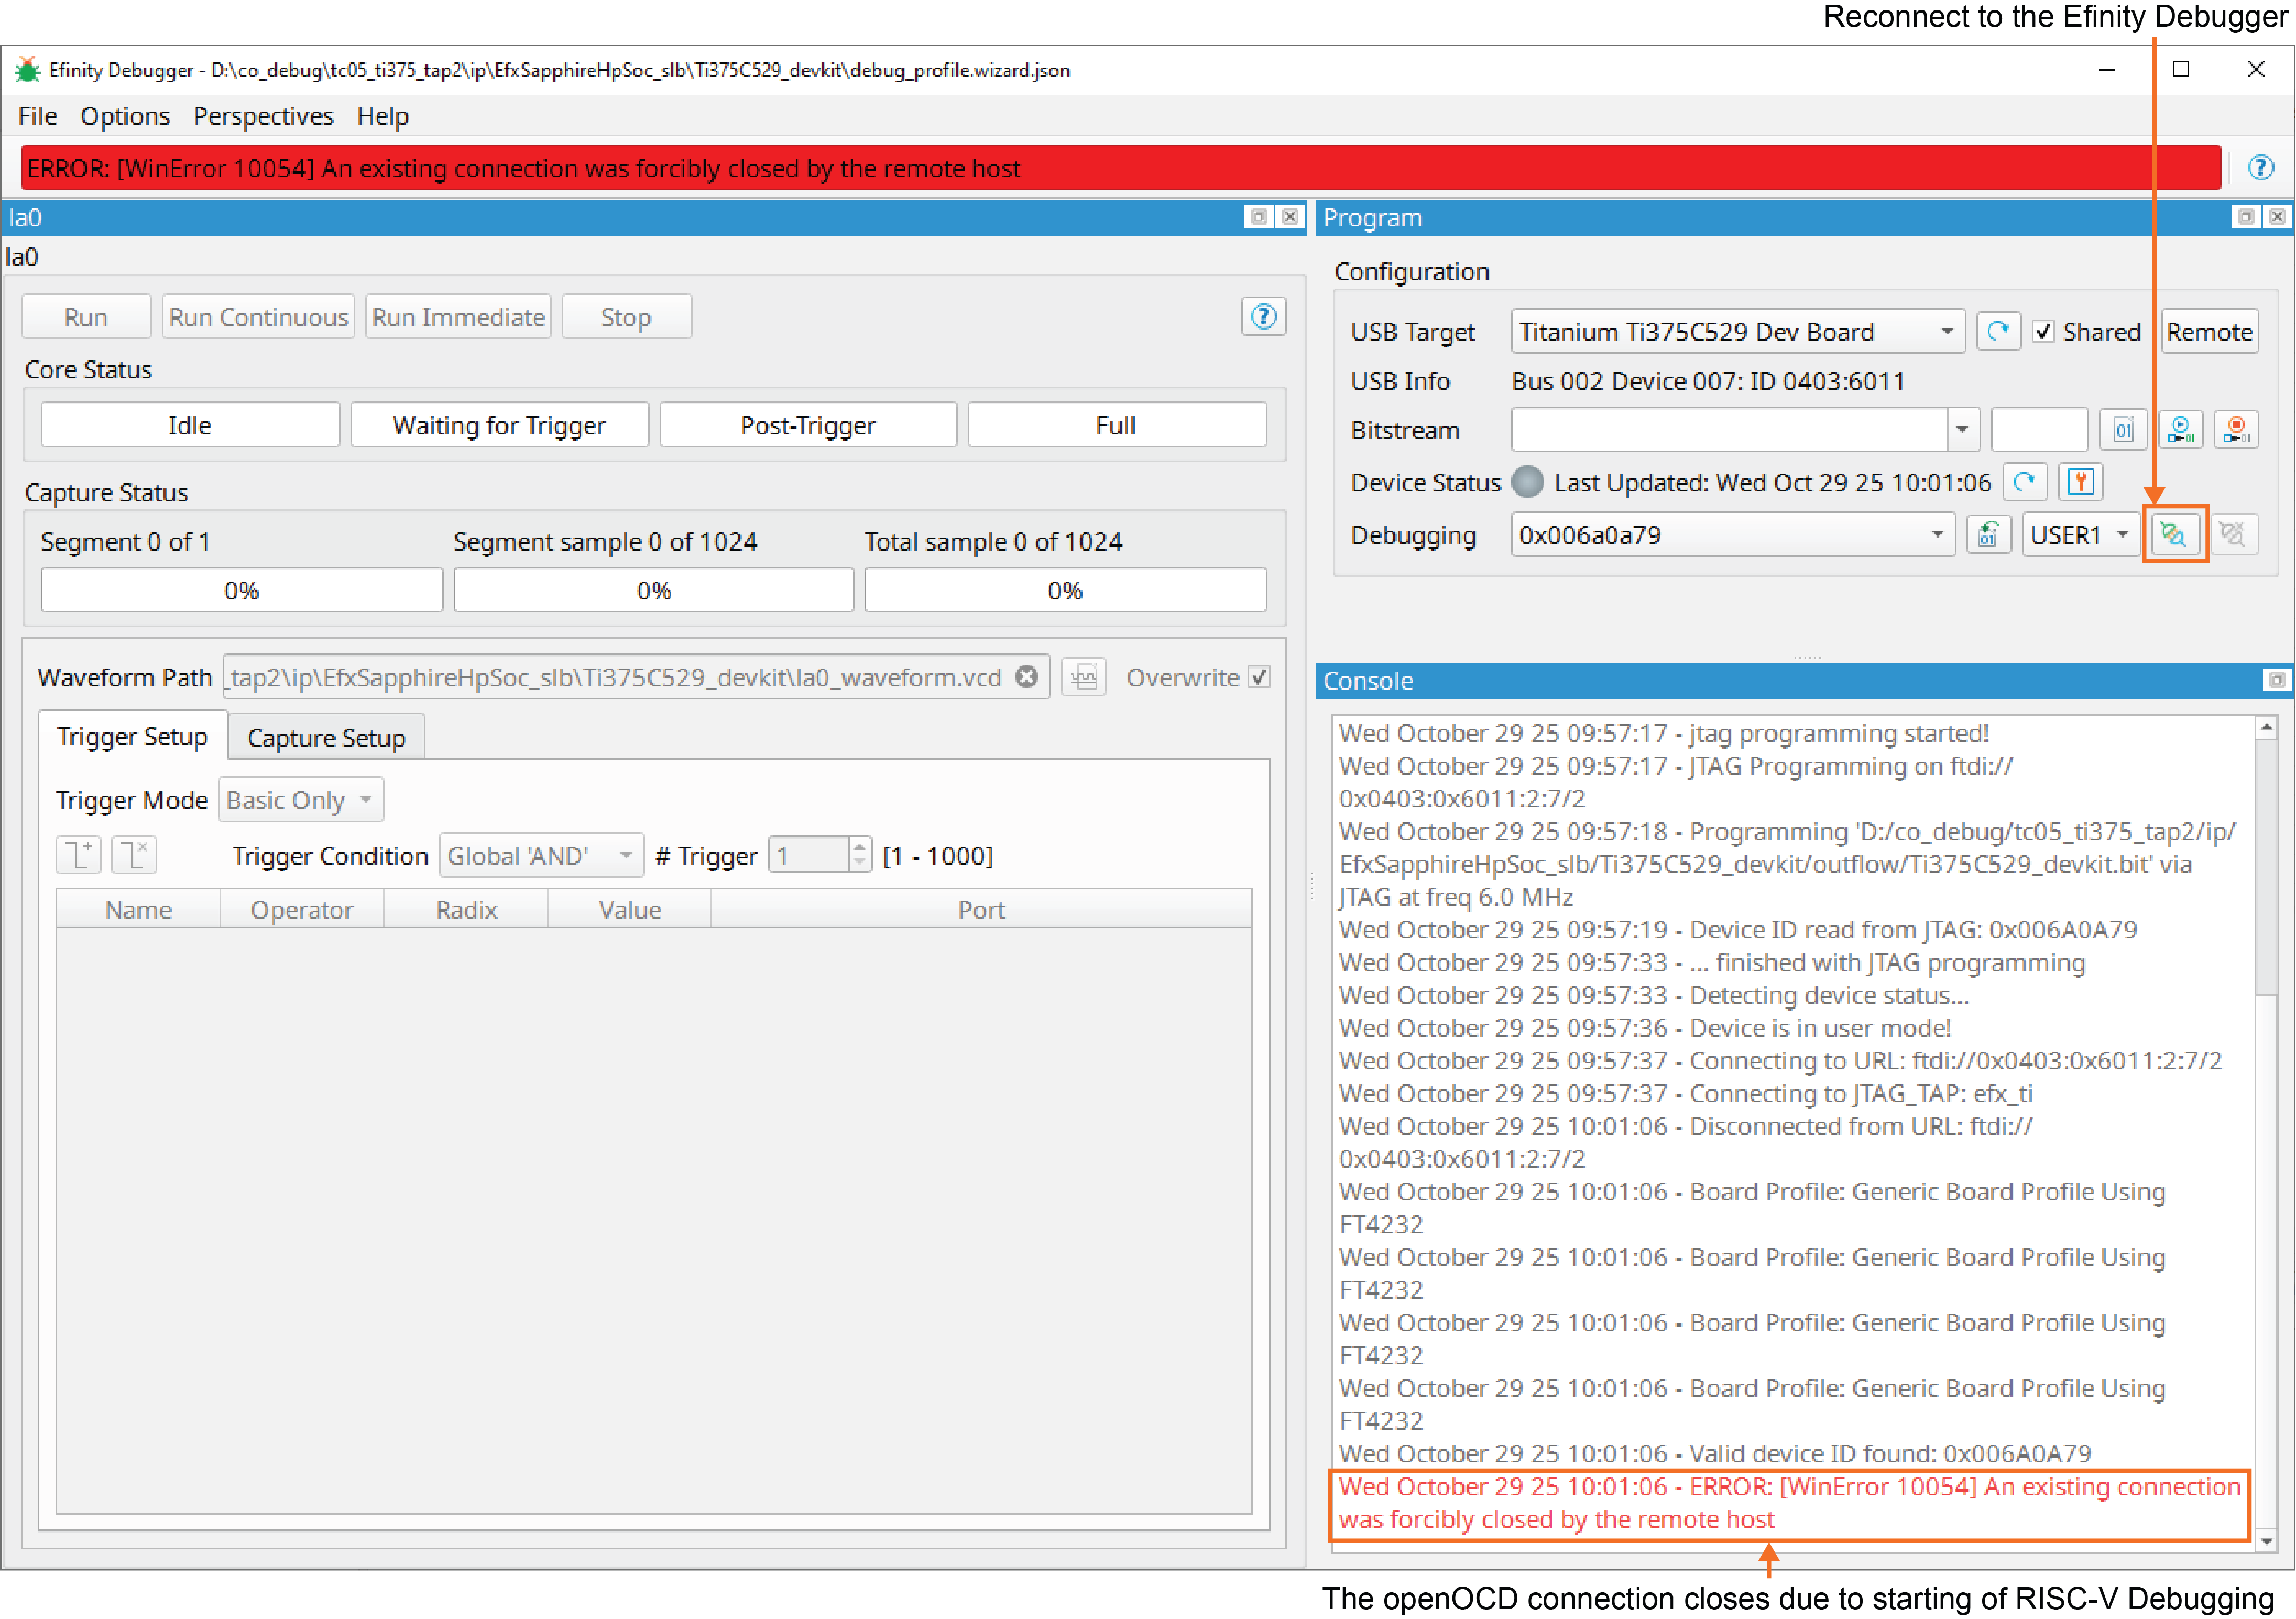
Important: You should always start RISC-V debugging
first, and then RTL debugging. If you do RTL debugging first, the openOCD connection
will close. If this happens, re-connect the Debugger.