Debug with Watchpoint
About this task
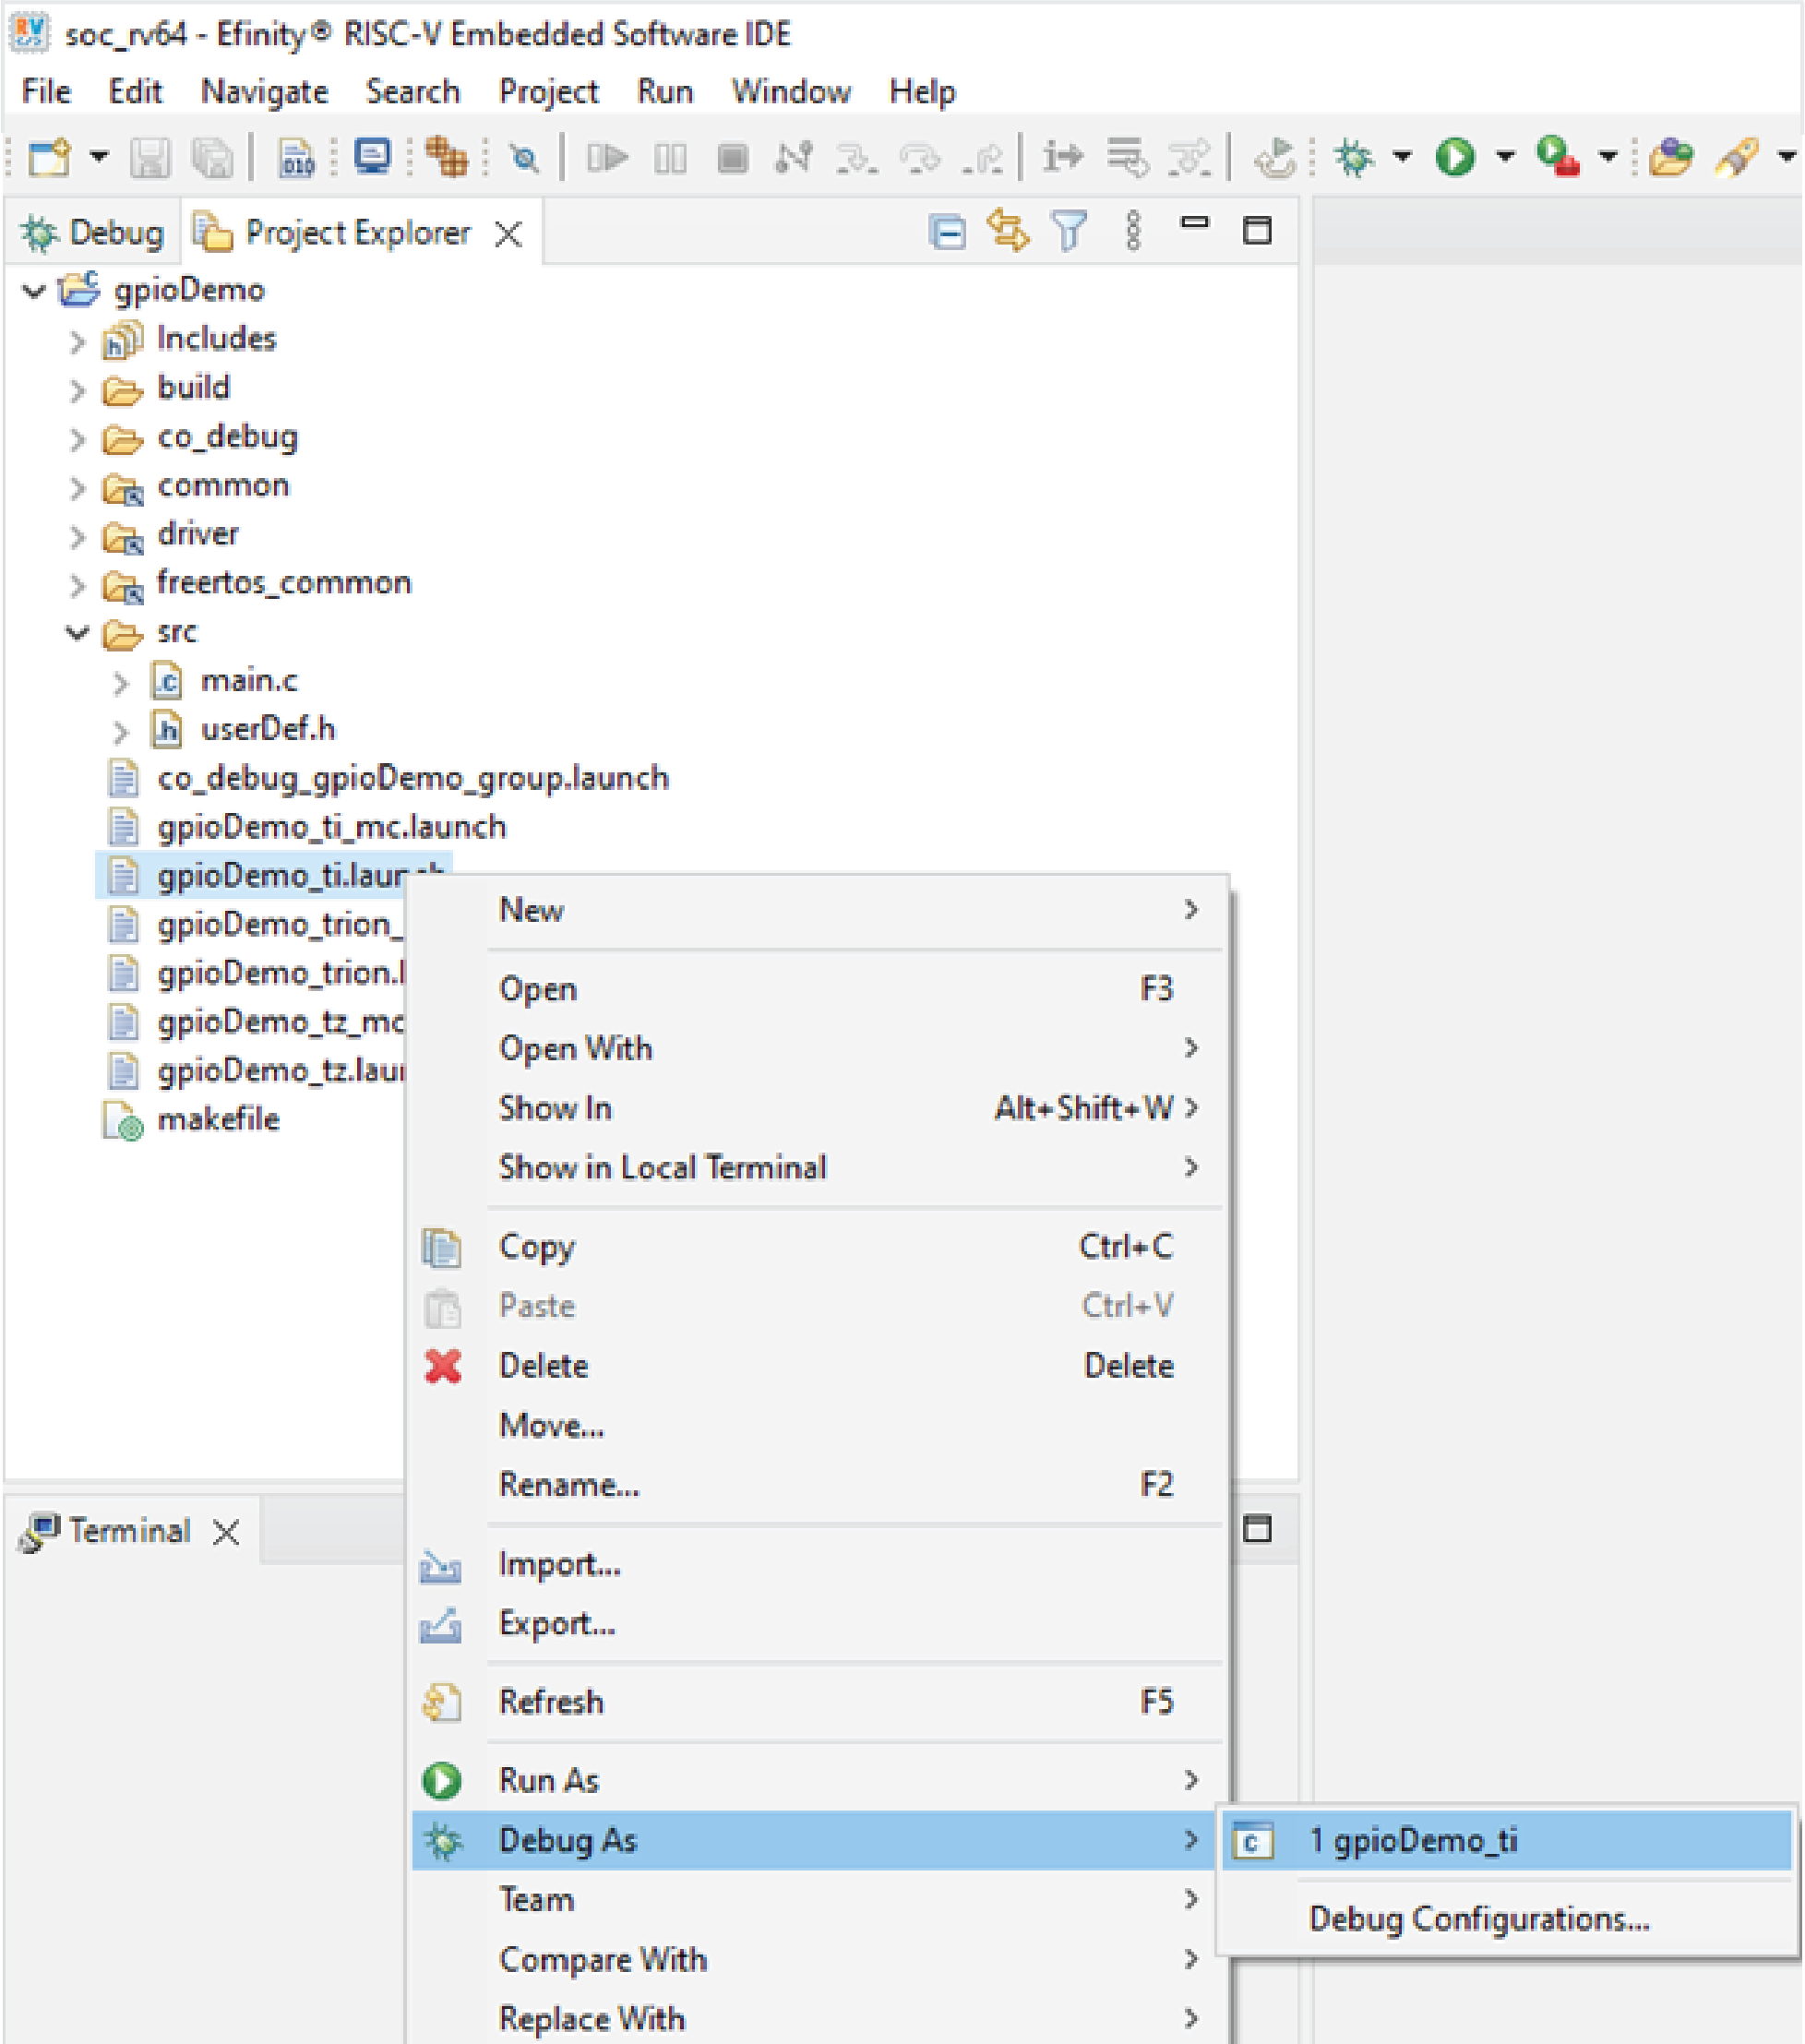
To start debugging with the watchpoint enabled:
- Right-click on the .launch configuration.
- Debug with the GDB Run Configuration.
When the selected variable is accessed according to the configured watchpoint condition, the debugger automatically halts execution at the corresponding source line.
You can inspect on the following:
- Variable values
- Memory contents
- Registers
- Call stack information
This helps to identify where and when the variable changes during program execution.